Looking back at Construction Cost / Supply Chain Trends in 2022
By: Andrew Halphen, Director of Preconstruction
2022 was certainly an interesting year for those in the preconstruction business. Estimating project cost, while historically a difficult trade, entered a new era of difficulty amid the challenges beset by supply chain disruptions and inflation. Preconstruction team members have learned to be flexible & creative to adapt to the ever-changing market to be solution-focused advisors to our clients.
Throughout 2022 our preconstruction teams have focused on finding solutions to the ever-challenging cost escalation and supply chain challenges. We have offered successful alternative manufacturers for items such as insulation, roofing, chillers & many others. At the time, joists had lead times of an unprecedented 9-12 months, we worked w/ engineers to design with standard steel beams in lieu of joists. We proposed concrete framed buildings in lieu of structural steel when steel was at an all-time high. As of late, with steel down and ready mix up, we now collaborate during the design phase to propose options for structural steel buildings in lieu of concrete framed buildings where it makes the most economic sense. With the lead times of 52 weeks for items such as switchgear and chillers, we have advised clients to utilize early packages to start procurement earlier in the process to secure long lead items. Understanding the market trends as they have occurred has provided our precon teams with the information to provide best value costs and schedule solutions to our clients.
In this post, we will be looking at some key factors that impacted pricing in 2022. After the new year, we will release another post looking forward to 2023.
Learning from 2021. For much of 2021, estimators were shouting from the rooftops about inflation. Raw goods like steel and lumber saw massive price increases resulting in serious challenges for anyone trying to procure structural steel or wood framing.
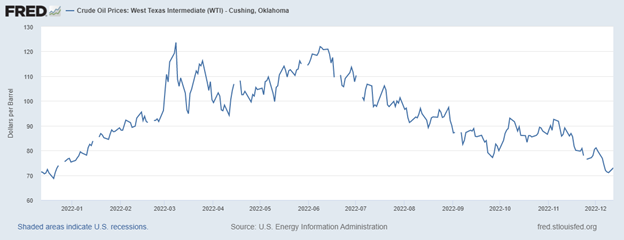
February – Russian Invasion of Ukraine. On February 24, 2022, it launched its invasion of Ukraine. While the invasion was not wholly unexpected, the resistance faced was certainly a surprise to many. As a result, there was a rapid shift in expectations, and the economy began to feel the effects. On February 23rd, the price of WTI Crude oil stood at $92.14 by March 8th, pricing reached $123.64. Prices began to fluctuate and resulted in major sticker shock to consumers and builders throughout the summer. Almost immediately after the invasion, fuel surcharges began to hit, and many vendors are still refusing to honor freight prices until the known time of shipment.
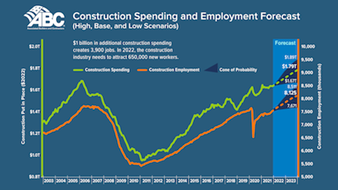
March – Labor shortages = More expensive labor. In Early 2022 ABC issued a Construction Spending and Employment Forecast. Their forecast about the difficulty of finding skilled or even interested labor proved true for many of our trade partners.
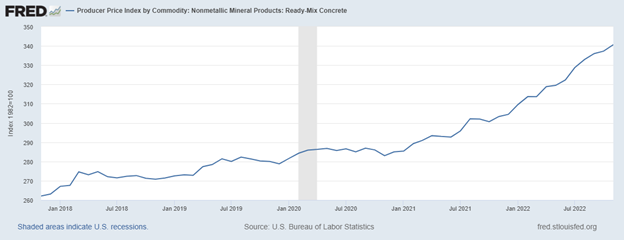
March – Ready Mix Disruptions. We first heard from suppliers in March that cement manufacturers in various regions of the US were beginning to institute allocations for purchasing. Since that time, the price of cement and the ready-mix concrete that uses it has seen substantial increases. Since the beginning of 2021, we have seen a national average increase in ready-mix of 19.5%.
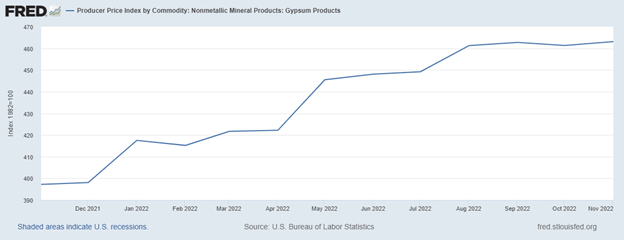
April – Metal Stud and Drywall Pricing. In April, we started to see substantial price increases related to drywall contractors. A perfect storm hit the trade, with both gypsum products and metals seeing price increases. Year to date, we have seen a 16% price increase in gypsum products.
May – Bankruptcy makes an appearance. In the spring of 2022, we began to hear rumblings of financial issues with a larger flooring manufacturer. By May, it became apparent that things were worse than expected, which resulted in their bankruptcy and subsequent purchasing by another firm.
Armstrong Flooring to sell assets to AHF, Gordon Brothers – Floor Covering News (fcnews.net)
June – Glass goes up and up. In June, float glass manufacturers announced price increases of up to 40%. This resulted in Viracon (one of the leading suppliers of insulated glass units) raising their prices by 5-12%. Another factor impacting the end unit pricing of exterior glass systems is that during the same time frame, the price of aluminum coatings was increasing.
June – Steel Pricing PEAKED. On the positive side, steel pricing is showing relief. In January 2021, structural steel pricing started to climb at a rapid pace. From that time through the summer of 2022, we saw monthly price increases on almost all steel-framed projects. Prices for structural steel increased 66% from January 2021 to the peak of June 2022. Steel has started to trend back down in the last few months.
July – commodities go down? A number of key commodities tracked by our team were showing signs of trending down. Lumber, Steel, Copper, and Aluminum were all falling from their respective peaks.
@LB.1: 376.30 UNCH (UNCH) (cnbc.com)
@HRC.1: 671.00 UNCH (UNCH) (cnbc.com)
@HG.1: 3.7645 -0.0185 (-0.49%) (cnbc.com)
@AL.1: 2,368.00 UNCH (UNCH) (cnbc.com)
August – Lead times. Throughout most of early 2022, we were seeing lead times decrease for many products used in general building construction. Unfortunately, not all trades followed the trend. Beginning in the summer, lead times for HVAC and Electrical equipment began to increase significantly. It has now become common for this type of equipment to run north of 52 weeks AFTER approval of shop drawings and submittals.
September – Slowing the price increases. By September, it became apparent that not all pricing would continue to go up continuously with no end in sight. In the chart below, you can see that while monthly %+ increases had become common, the increases were starting to slow (ENR Building Cost Index, monthly %change).
2021 |
2022 |
||||||||||||||||||||
| JAN | FEB | MAR | APR | MAY | JUN | JUL | AUG | SEP | OCT | NOV | DEC | JAN | FEB | MAR | APR | MAY | JUN | JUL | AUG | SEP | OCT |
| 0.53% | 0.80% | 1.02% | 2.15% | 1.81% | 1.89% | 2.78% | 0.18% | 0.42% | 0.15% | 0.47% | 0.96% | 1.34% | 1.44% | 1.48% | 1.41% | 1.34% | 0.77% | 0.03% | 0.07% |
October – Feeling the impact of pricing. In October, AGC released an update of their bid price index, reporting an increase of 24% year-over-year (y/y).
AGC Data DIGest: October 10-18, 2022 | Construction Citizen
December – Maybe a peak? Many of the projects we build require trade partners to hold pricing for 30-90 days. The consensus among our regions is that while very few trade partners are willing to put anything in writing, many of our key trade partners are expecting to see lower prices in 2023. While the sentiment is true for most of the trades we deal with, we still expect to see pricing increases related to Mechanical and Electrical Equipment.